Short answer: The average measured THC content of cannabis has risen in several studied markets. For Europe, one study estimated an increase from 8.14 to 17.22 % THC in cannabis resin between 2006 and 2016, and from 5.00 to 10.22 % in herbal cannabis. The EU Drug Report 2026 cites 24.6 % for seized resin and 12 % for seized herbal cannabis in 2024. These figures come from different datasets with varying coverage. They do not form a continuous European measurement series from the 1970s to the present day. Freeman et al., 2019; EUDA, 2026.
At a glance: which time periods are documented?
| Time period | What was examined | Reliable finding |
|---|---|---|
| 1970–2017 | Twelve studies from seven countries, including five European ones; different sample types | The meta-analysis found an upward THC trend, but no uniform EU time series. |
| 1990s to early 2000s | Older European laboratory and market observations | Intensively cultivated, seedless flowers appeared more prominently; early resin data showed no consistent upward trend across Europe. |
| 2006–2016 | Modeled country figures from EU member states of the time, Norway and Turkey | Resin 8.14 → 17.22 %; herbal cannabis 5.00 → 10.22 % THC. |
| 2014–2024 | Indexed EUDA series, base year 2014 = 100 | Resin index 100 → 166; flower index 100 → 119. These are relative increases of 66 % and 19 %. Both series reached their peak in 2023 (178 and 143 respectively). |
| 2024 | EUDA figures on seizures in the EU | Resin average 24.6 %, herbal cannabis 12 % THC. National averages range from 7.3 to 33.5 % for resin and from 2.9 to 17 % for flowers. |
Important for all charts: A line connects only values within the same study and method. The following results from different publications are not combined into a single curve.
How far back do the older data reach?
A systematic review with meta-analysis evaluated twelve studies from the USA, the United Kingdom, the Netherlands, France, Denmark, Italy and New Zealand. The observations cover the period from 1970 or 1975 to 2017, depending on the product group. For herbal cannabis, 66,747 samples were available; for resin, 17,371 samples from eight studies. The publication is not entirely consistent in the number of studies for herbal cannabis: the abstract cites eight, the results section seven. The pooled, within-study estimated annual change was 0.29 percentage points of THC for herbal cannabis (95 % confidence interval 0.11–0.47) and 0.57 percentage points for resin (0.10–1.03). Studies from the USA, the United Kingdom, Italy and New Zealand fed into the flower trend; the Netherlands, France and Denmark were added for the resin trend. Both estimates are therefore not independent EU averages. Freeman et al., 2021.
These figures are neither a measured annual increase in every country nor a forecast for 2024. The studies differed in terms of time periods, countries, samples and selection procedures. Statistical heterogeneity was high: I² = 94.2 % for herbal cannabis and 79.1 % for resin. The authors identified the mostly non-random sampling as an important risk of bias. Furthermore, it is not possible to directly infer from a seizure which products all consumers actually used.
What changed in the 1990s?
A chapter by Leslie King in an EMCDDA collected volume from 2008 describes the increased emergence of intensively cultivated, seedless flowers (“sinsemilla”) from the early 1990s onwards. This product group had on average higher THC values than traditionally imported herbal cannabis. The distributions overlapped, however: older imported samples could also show high THC values. The same report cautioned against scarce historical data, differing sample preparation and measurement practices, and inconsistent distinctions between product groups. For imported resin, the early material showed no simple pan-European upward trend; King cites stable values of around 2–8 % THC for imported products over many years. The exception was the resin produced domestically in the Netherlands (“Nederhash”), whose potency rose rapidly after 1999. The history therefore cannot be summarized as “everything was weak in the past, everything is strong today”.
The later meta-analysis found an increase for all herbal cannabis samples, but no equally clear pooled increase in the separately examined groups of “sinsemilla” and “traditional flowers”. Their explanation: a larger market share of the higher-potency product group can raise the overall average even if the average within each group changes little. This is an interpretation by the study authors, not a directly measured cause for each individual market. Freeman et al., 2021.
What do the European data from 2006 to 2016 show?
Freeman and colleagues evaluated repeated country figures from the then 28 EU member states as well as Norway and Turkey using mixed regression models. The number of countries with suitable THC figures varied from year to year. For resin, for example, there were 15 countries in 2006 and 15 in 2016; for herbal cannabis, 15 and 19 respectively. The figures in the chart are model estimates with 95 % confidence intervals, not measurements of each individual batch.
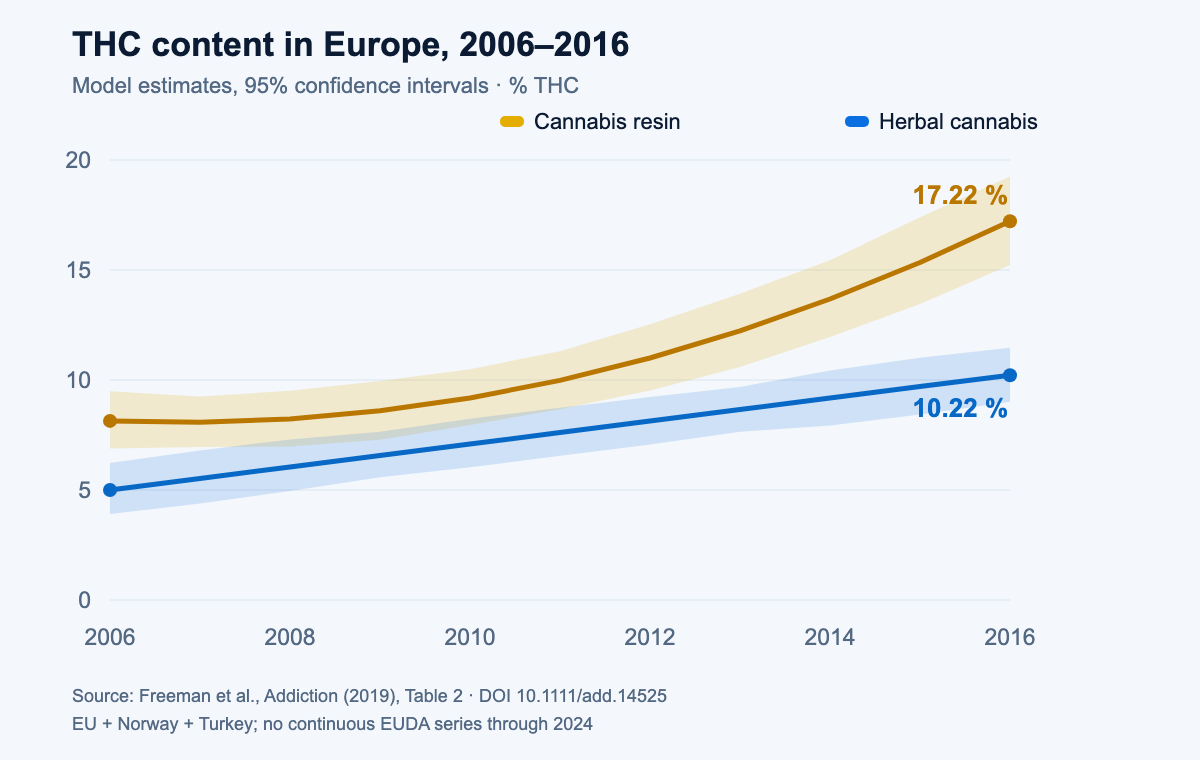
Figure 1: THC content of cannabis resin and herbal cannabis in the analysis by Freeman et al. (2019), Table 2. Area: EU countries of the time, Norway and Turkey; country coverage varied. The figure ends in 2016 and is deliberately not connected to the later EUDA index series. Open chart at full size.
| Product group | 2006, modeled mean (95 % CI) | 2016, modeled mean (95 % CI) | Difference |
|---|---|---|---|
| Cannabis resin | 8.14 % (6.89–9.49) | 17.22 % (15.23–19.25) | +9.08 percentage points |
| Herbal cannabis | 5.00 % (3.91–6.23) | 10.22 % (9.01–11.47) | +5.22 percentage points |
For resin, the model showed the stronger increase mainly after 2011. For herbal cannabis, a more consistent trend emerged. The paper discusses new production methods and altered compositions as possible explanations. The data do not, however, identify any particular cultivation method as the sole cause. Original study with Table 2 and methodology.
What does the more recent EUDA series say for 2014 to 2024?
The European Drug Report 2026 reports an EU average of 24.6 % THC for seized cannabis resin and 12 % for seized herbal cannabis in 2024. The resin average was thus 12.6 percentage points higher and roughly twice as large as the flower average. This statement refers to the reported product groups, the area and the data year. It is not an analytical result for any arbitrary batch.
The data tables for the report show how far apart the countries are. The basis is national averages assigned to the retail level in the EUDA chart. The table lists for each country 2024 or the most recent available year:
| Product group | Lowest national average | Middle half of countries | Highest national average | EU average |
|---|---|---|---|---|
| Cannabis resin | 7.3 % | 23.1–29.3 % | 33.5 % | 24.6 % |
| Herbal cannabis | 2.9 % | 10.1–14.5 % | 17.0 % | 12 % |
The highest national average is 4.6 times as high as the lowest for resin, and 5.8 times for herbal cannabis. A single EU figure conceals these differences. EUDA, Figure 2.6 with data tables.
For the trend, the EUDA cites indexed trends: setting the respective 2014 value to 100, resin reaches an index of 166 in 2024 and herbal cannabis 119. This means a relative increase in the average THC content of 66 % and 19 % respectively. An index value of 166 is not a THC content of 166 %, and “+66 %” is not “+66 percentage points”.
The data table for the report also lists the intervening years:
| Year | 2014 | 2015 | 2016 | 2017 | 2018 | 2019 | 2020 | 2021 | 2022 | 2023 | 2024 |
|---|---|---|---|---|---|---|---|---|---|---|---|
| Resin (index) | 100 | 104 | 112 | 117 | 128 | 147 | 148 | 155 | 164 | 178 | 166 |
| Herbal cannabis (index) | 100 | 95 | 98 | 104 | 99 | 99 | 102 | 99 | 105 | 143 | 119 |
The resin index rose every year until 2023 and fell in 2024. The flower index remained between 95 and 105 until 2022, jumped to 143 in 2023 and fell to 119 in 2024. Whether the 2023 jump reflects a market change or a different country composition cannot be determined from the report alone.
The EUDA notes that the countries vary depending on the indicator. The difference between the 2016 figure from the study and the 2024 figure from the EUDA must therefore not be interpreted as a precisely measured eight-year increase within the same sample. The 2006–2016 analysis also included Norway and Turkey, whereas the cited 2024 figure concerns the EU.
Why can a market average not describe an individual batch?
THC percentage values describe a proportion of the investigated material mass. They initially say nothing about how much material a person uses, how much THC becomes available in a particular application, or what quantity reaches the body. Different batches and product types can vary greatly. An EU average therefore replaces neither a batch-specific laboratory report nor an exposure measurement.
The supplementary article Plant material, THC content and dose explains which measurements lie between a laboratory percentage value and the actual exposure. There too, no individual dose is derived from a THC percentage value.
In addition, the selection of samples influences the average. Seizures result from police operations; they are not a random complete survey of all products sold. Differences between countries, categories and analytical methods can make time comparisons difficult. Anyone writing “cannabis has 24.6 % THC” omits the crucial details: resin, seizures, EU, 2024, average.
All sources cited here list only two product groups: resin and herbal cannabis. Extracts, oils or edibles do not appear in these averages. This text is therefore not a comparison of all cannabis products available today.
Frequently asked questions
Was cannabis fundamentally weaker in the 1970s?
The meta-analysis supports an increase in average THC contents in several studied markets over decades. It does not establish a single “typical 1970s batch” for all of Europe. Even then, resin and flowers, origin, storage and sample selection differed. A blanket figure for “cannabis back then” would be misleading.
Has THC content in Europe risen every year?
No, a long-term increase does not mean an increase in every country and every year. The 2006–2016 study shows modeled, product-specific trends with uncertainty. In the EUDA series 2014–2024 as well, the index fell in 2024 for both product groups compared to 2023. Local series may diverge further.
What does “2014 = 100” mean in the EUDA chart?
This is an index: for each product group, its own baseline value from 2014 serves as the reference point. A resin index of 166 in 2024 means 66% more than the resin baseline value. This implies neither a THC content of 166% nor a comparison of the absolute 2014 THC values between resin and herb.
How high was the average THC content in 2024?
For seized material in the EU, EUDA reports 24.6% for cannabis resin and 12% for herbal cannabis. National averages range from 7.3% to 33.5% for resin, and from 2.9% to 17% for herb; individual batches may deviate even more strongly. EUDA original report.
Sources, Selection and Updates
This text is an evidence-based literature review, not an independent systematic review. Sources checked up to 29.09.2026 include the EUDA primary presentation for 2024 together with data tables for Figure 2.6, the original study with a European modeled series from 2006–2016, the historical meta-analysis, and an older EMCDDA methodology report. Data were separated by product group, region, time period, measure, and sample source. Figures in Figure 1 were taken from Table 2 of the original study; the endpoint differences in the table were calculated from these. Following the publication of a new EUDA annual report, the section on the most recent data should be updated.
- Freeman TP, Groshkova T, Cunningham A, Sedefov R, Griffiths P, Lynskey MT. Increasing potency and price of cannabis in Europe, 2006–16. Addiction. 2019;114:1015–1023. DOI: 10.1111/add.14525.
- Freeman TP, Craft S, Wilson J, Stylianou S, ElSohly M, Di Forti M, Lynskey MT. Changes in delta-9-tetrahydrocannabinol (THC) and cannabidiol (CBD) concentrations in cannabis over time: systematic review and meta-analysis. Addiction. 2021;116:1000–1010. DOI: 10.1111/add.15253.
- European Union Drugs Agency (EUDA). Cannabis – the current situation in Europe. European Drug Report 2026, data year 2024, section “Market data for cannabis”, tables EDR26-Cannabis-7 and -8. Original report.
- King LA. Understanding cannabis potency and monitoring cannabis products in Europe. In: European Monitoring Center for Drugs and Drug Addiction (EMCDDA), ed. A cannabis reader: global issues and local experiences, vol. 1. Lisbon: EMCDDA; 2008, Monograph series 8, chapter 14, pp. 239–259. ISBN 978-92-9168-311-6. DOI of the collected volume: 10.2810/13807. Original PDF.